Recently in Melbourne Australia, the wanderings of a baby infected with measles prompted Victoria’s Chief Health Officer Dr Rosemary Lester to name certain venues and alert the public. The 11 month old had, while infectious, visited four major shopping complexes, two restaurants, a cafe, a children’s play centre, a church and a chemist. Dr. Lester stressed those who attended these venues should ensure they pay extra attention to symptoms such as;
…common cold symptoms such as fever, sore throat, red eyes and a cough. The characteristic measles rash usually begins 2-5 days after the first symptoms, she said, generally starting on the face and then spreading to the rest of the body.
A bit of a rash, sore throat and temperature then. I’ve heard groups who insist vaccines don’t work or aren’t needed pass measles off as nothing to worry about. Yet the article also included this from Dr. Lester;
“Anyone developing these symptoms is advised to ring ahead to their GP or hospital and alert them that they have fever and a rash,” Dr Lester said. “If you know you have been in contact with a measles case please alert your GP or hospital emergency department. The GP or hospital will then be able to provide treatment in a way that minimises transmission.”
Hmmm. Maybe hospitals in Victoria are running drills this month. Practising for something serious with this little rashy-coughy thing. After all a Slovakian micro-palaeontologist had described it as a simple “right of passage”. And if anyone would know about infectious disease in Australia it is a Slovakian micro-palaeontologist, not a mere Chief Health Officer of a state holding around six million people. But then the piece by the paper’s Health Editor went on to state measles is highly infectious. It is particularly dangerous for young children and young adults.
Those most at risk of getting the disease are people who have not been vaccinated, particularly adults between 33 and 47 years because many in this age group did not receive measles vaccine, and people whose immune systems have been compromised because of cancer treatment, for example.
Perhaps, as they say, this is not a drill. I remember reading material from those against vaccination. They spend a lot of time and caps lock justifying why vaccines are dangerous, or useless, or part of a conspiracy. The claim that vaccines are useless is backed by graphs which plot disease induced mortality against time and contend X vaccine was introduced well after mortality reached zero. Clean water, nutrition and better living standards stopped these infectious diseases they insist, not vaccines. So I decided to check the measles graphs drawn up by renowned antivaccinationist Greg Beattie.
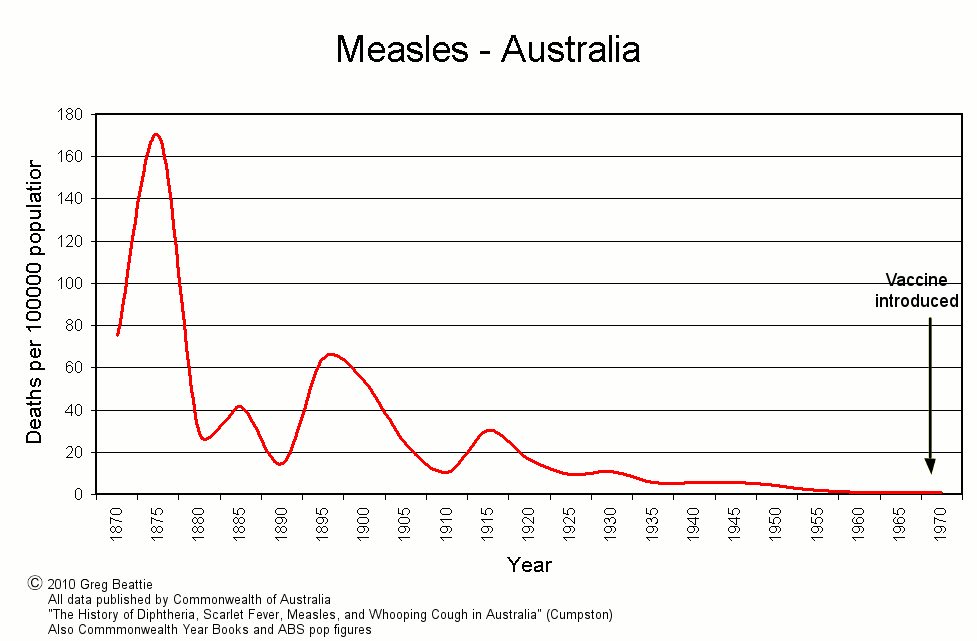 Greg Beattie’s “Figure 1” from Fooling Ourselves
The above graph is from Beattie’s Fooling Ourselves. The Australian Vaccination-sceptics Network is littered with this and many others from Beattie. Material published by the AV-sN has been independently examined and discredited in the preparation of a public statement and warning by the NSW Health Care Complaints Commission. It appears then, Beattie’s graphs have been examined and discredited in an official capacity. There is no mistake as to why the HCCC warned the public to exercise caution in viewing “misleading” material. It is important to focus on Beattie’s intent here. Namely that vaccines had no impact or an irrelevant impact on the control of infectious disease. In part this post challenges the intent of Beattie’s graphs by presenting independent data that show vaccines most certainly had a powerful effect in controlling the spread of vaccine preventable disease.
Thus Beattie’s cunning use of mortality rate above, is met with absolute and predicted numbers. Greg Beattie cites the Australian Bureau of Statistics, Commonwealth Year Books and “data published by the Commonwealth” in Cumpston’s 1927 The History of Diptheria, Scarlet Fever, Measles and Whooping Cough in Australia. One notes the first problem is his reliance on mortality and not morbidity. Death as a consequence of a vaccine preventable disease is a limited indicator of how effective vaccination has been in reducing infection. Overall morbidity (infection) offers a more realistic picture. Indeed the anti-vaccine lobby are today only too quick to point to the number of pertussis notifications in those vaccinated, when launching attacks on the efficacy of the vaccine or the need to be vacccinated. They concomitantly avoid noting pertussis mortality in Australia hits the unvaccinated.
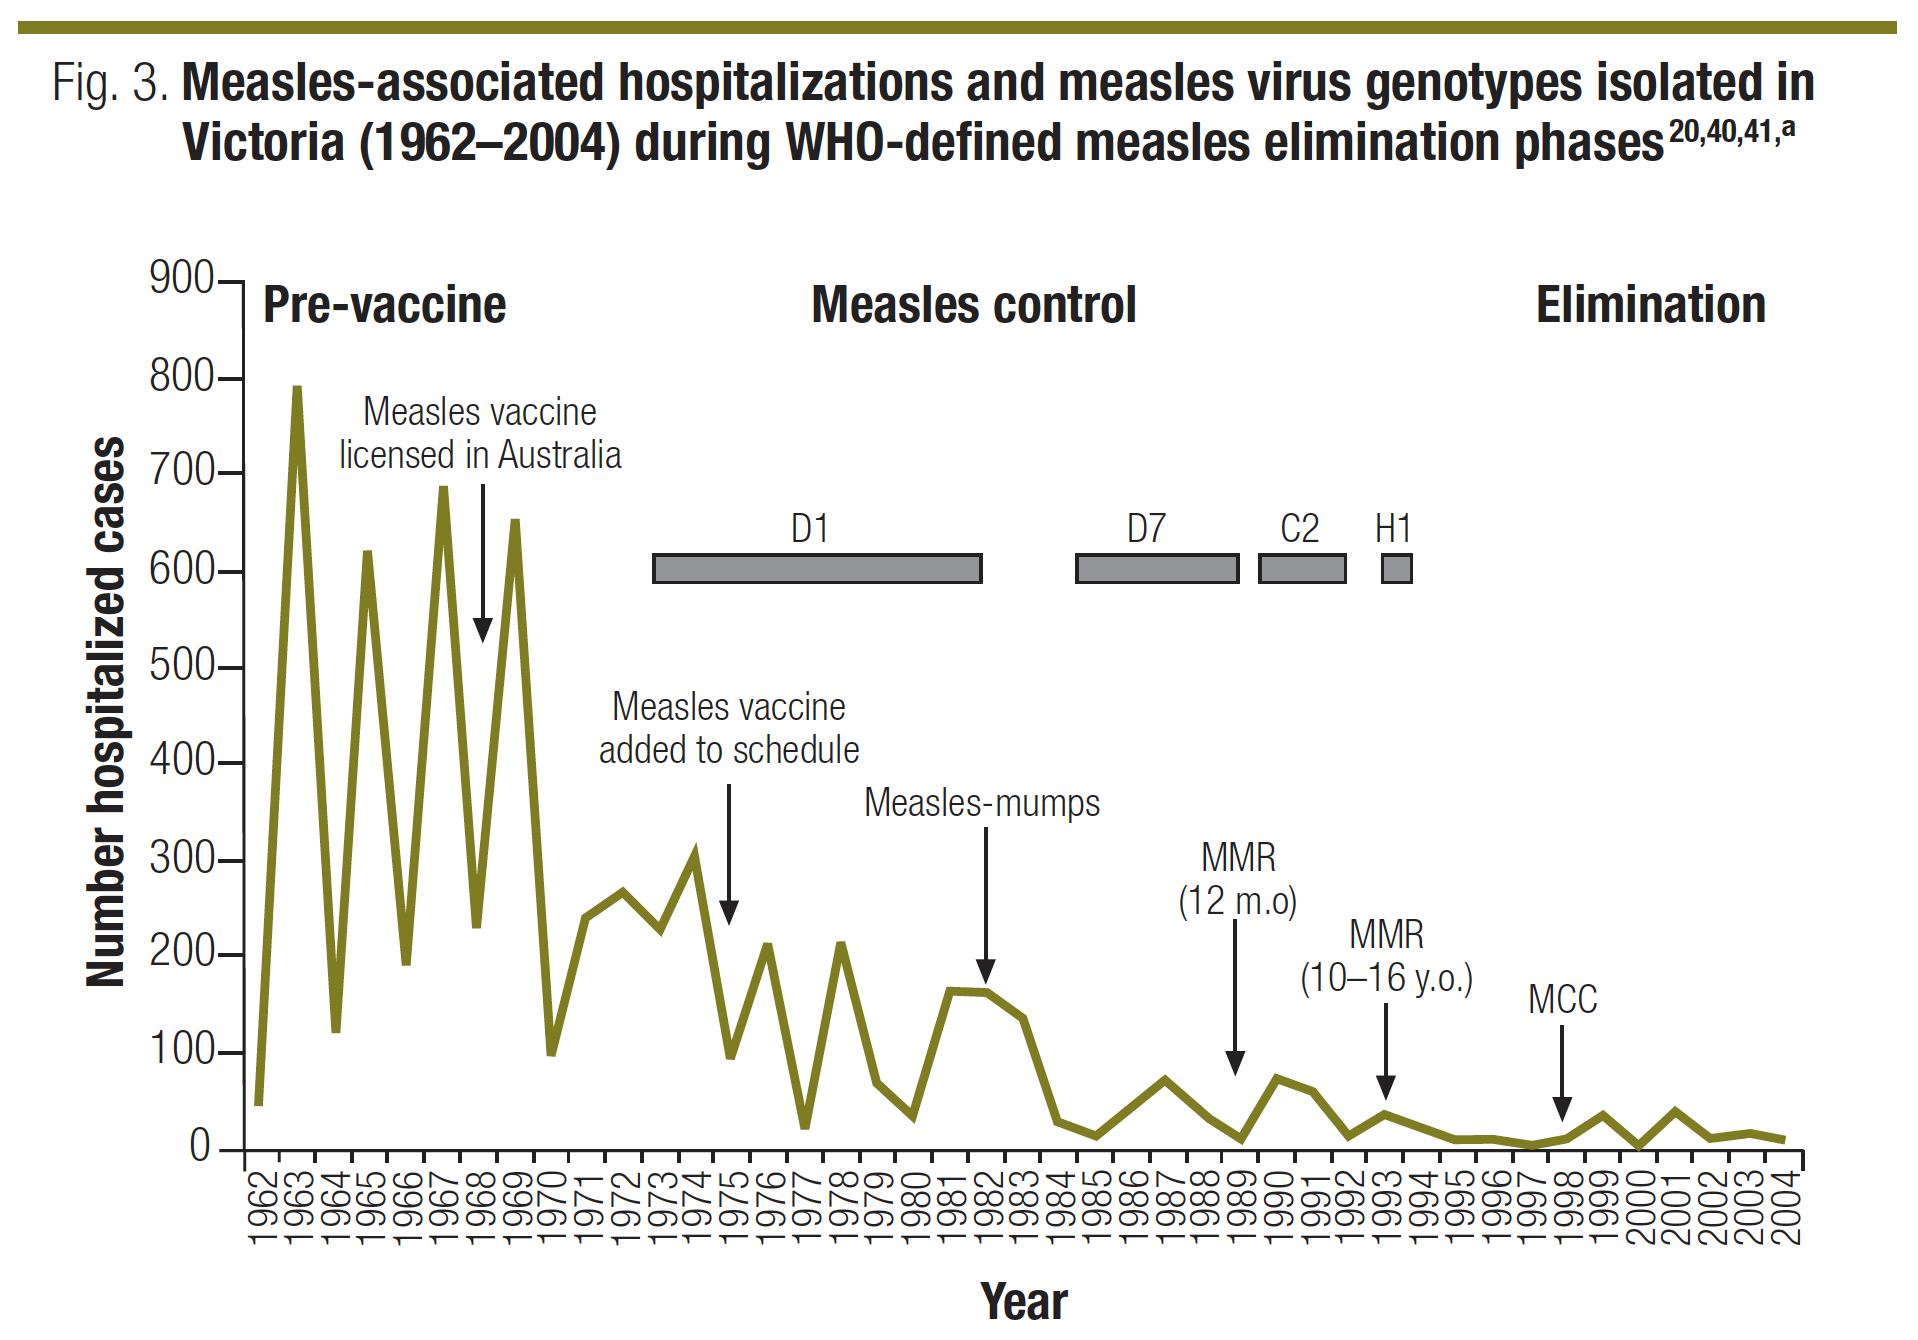
The vaccinated cop a less dangerous, and to date, non-lethal infection. [Update] Children not vaccinated against pertussis are 24 times more likely to be infected with the wild strain, than those who are vaccinated. Below is another graph from Communicable Diseases Intelligence. I’ve boxed in measles in red and used coloured horizontal lines to link mortality to years pre and post introduction of the measles vaccine. It’s clear that the greatest gap – or in fact drop – in mortality follows the introduction of measles immunisation. Thereafter reductions are smaller and more evenly spaced. 
Source: Communicable Diseases Intelligence
Could there be more important facts left out by Beattie? Clearly his graph is designed to visually convince the reader that the measles vaccine was introduced when measles was all but eradicated. Thus Beattie contends vaccination had no impact on its control. So what of Beattie? Do we afford him the benefit of the doubt? You be the judge. Immediately after the graph he writes in Fooling Ourselves.
The graph for measles (Figure 1) shows us that the five-yearly death rate, 100 years before the vaccine was introduced, was around 170. One hundred years later, and immediately prior to introducing the vaccine, it was less than one. That’s a reduction of 99.5%—before the vaccine arrived. The remainder of less than 1% is therefore the only portion of the decline to which the vaccine can possibly lay claim, because it simply was not around for the first 99.5%. […]
Let’s check that again: One hundred years later, and immediately prior to introducing the vaccine, it (the five year mortality rate from measles) was less than one. Looking at the CDI graph above, and countless others that can (Source: Measles Deaths, pre-vaccine – archived) be wheeled out from developed nations around the world he is simply misinforming his readers.
Update 10 January 2024: I originally published this post with no display of the graph in question. They are USA data, and the aim here is to expose Beattie’s deception, referencing the Australian figures he worked so hard to conceal. Recently, a pingback alerted me to the fact one Jordan Henderson criticised my linking to it. Jordan opined;
For example; he attempts to claim that Beattie’s Australian death rate graph is wrong by referencing a graph for the USA as if that somehow makes the Australian graph wrong because it doesn’t show what the USA graph shows.
Errumm, yes. Or rather, no. The graph in question impressively eliminates Beattie’s case by simply highlighting the impact of vaccine introduction when actual numbers of deaths (not diluted using “per 100,000”) in a population larger than Australia, are presented. Include case numbers and the illusion of his craftwork vanishes. Also, if vaccines didn’t succeed, they didn’t succeed globally, would be my reasoning. Not just where Greg Beattie lived. Anyway, Jordan offers a cornucopia of conspiracy woo online. He writes numbered articles called “The Acorn”, and has sprouted bud by bud (sorry, couldn’t resist) into anti-5G, psyops, sheeple, the great reset, slavery, anti-mask beliefs, the awakening, more acorns and of course, being anti-vax. Now, as they all do as per their manual, he’s defending Beattie. Is Beattie a sprout I wonder? Perhaps more of a chunk of crispy old lichen, given the age of this tale.
So, onto the graph, with some added red annotation:

If QR codes are your thing, enjoy. Otherwise, it’s archived here now. Do read the piece, if the “clean water and sanitation, not vaccines controlled disease”, argument is one you’re entertaining. Engineering, clean water and sanitation did indeed catapult our health and standard of living forward. Diseases were controlled, but not eliminated. In the case of measles, vaccines later eliminated hundreds of fatalities per year and thousands of cases of brain damage, pneumonia, middle-ear infections, deafness and diarrhoea. But this argument is so petty, because we actually have successful vaccines developed long after sanitation, clean water and flushable toilets emerged.
Take the Hib vaccine. In 1985 the first Hib vaccine was launched in the USA. A more successful conjugate vaccine was licensed in 1987. Is it necessary? Have we actually seen its impact?
Hib can cause invasive diseases in young children and people who are immunocompromised. The case-fatality rate for Hib meningitis is between 3% and 6%. Up to 30% of individuals who survive Hib disease have permanent neurological sequelae. Source.
Okay, dear reader. Apologies for the interruption. Where were we? Ah yes. Up above we had… Let’s check that again: One hundred years later, and immediately prior to introducing the vaccine, it (the five year mortality rate from measles) was less than one.
Less than one for five years? Whilst the CDI graph plots 150 from 1966 – 1975. An excellent way to further debunk Beattie’s “vaccines-didn’t-save-us” mess is through statistical estimation of the deaths that would have occurred without immunisation. Cost effectiveness and the money saved through improved health is vital. Love it or loathe it the cost of running a vaccine-conspiracy would be monumental. The savings to be made in controlling infectious disease are also wonderfully impressive and much time and energy goes into ensuring we invest in what pays for itself. The figure loving, graph scribing, number crunching chaps at Applied Economics (archived) are deft hands at such dark arts. In a semantic flick of the bird to antivaccinationists they write;
The trend in measles deaths since 1940 reveals a secular decline. This reflects a reduction in case fatality associated with a general improvement in health status as well as the introduction of antibiotics in the late 1940s (Russell, 1988). By fitting a trend to measles deaths for the period 1940–69 and extrapolating it from 1970 onwards, we can estimate the deaths that would have occurred without immunisation. A trend can also be fitted to actual deaths that occurred with immunisation. The difference between these two trend curves is our estimate of the lives saved because of immunisation.
I’ll leave you dear reader to pop over and peer at their graphs revealing the “lives saved because of immunisation”. They also sacrifice many pure white A4 sheets doing the same with Hib vaccination. Nonetheless here is (the businesses end of) the table born of such mysterious chanting and ritual. Pre immunisation years from 1940 are available. The point here is to further debunk the antivaccinationist claim that vaccines did nothing. By analysing pre and post immunisation mortality and morbidity trends, a strong estimate of lives saved and disease prevented can be clearly demonstrated.
Estimated deaths due to, and notifications of, measles tabulated as with or without immunisation
Consequently estimated lives saved and estimated cases averted based solely on measles immunisation can be calculated as the difference
| Deaths | Notification | |||||
| Year | Without Immunisation | With immunisation | Estimated lives saved | Without immunisation | With immunisation | Estimated cases averted |
| 1970 | 16 | 10 | 6 | 110,693 | 77,000 | 33,693 |
| 1971 | 15 | 10 | 5 | 112,391 | 67,459 | 44,932 |
| 1972 | 14 | 10 | 4 | 114,061 | 59,100 | 54,961 |
| 1973 | 13 | 10 | 3 | 115,706 | 51,777 | 63,929 |
| 1974 | 13 | 9 | 4 | 117,325 | 45,362 | 71,964 |
| 1975 | 12 | 9 | 3 | 118,921 | 39,741 | 79,180 |
| 1976 | 11 | 9 | 2 | 120,494 | 34,817 | 85,677 |
| 1977 | 11 | 8 | 3 | 122,044 | 30,503 | 91,542 |
| 1978 | 10 | 8 | 2 | 123,574 | 26,723 | 96,851 |
| 1979 | 10 | 7 | 3 | 125,083 | 23,412 | 101,671 |
| 1980 | 9 | 7 | 2 | 126,573 | 20,511 | 106,062 |
| 1981 | 9 | 7 | 2 | 128,044 | 17,969 | 110,075 |
| 1982 | 8 | 6 | 2 | 129,497 | 15,743 | 113,754 |
| 1983 | 8 | 6 | 2 | 130,932 | 13,792 | 117,140 |
| 1984 | 8 | 6 | 2 | 132,351 | 12,083 | 120,268 |
| 1985 | 7 | 5 | 2 | 133,753 | 10,586 | 123,167 |
| 1986 | 7 | 5 | 2 | 135,139 | 9,274 | 125,865 |
| 1987 | 6 | 4 | 2 | 136,511 | 8,125 | 128,385 |
| 1988 | 6 | 4 | 2 | 137,867 | 7,118 | 130,749 |
| 1989 | 6 | 4 | 2 | 139,209 | 6,236 | 132,973 |
| 1990 | 6 | 4 | 2 | 140,537 | 5,464 | 135,074 |
| 1991 | 5 | 3 | 2 | 141,852 | 4,787 | 137,065 |
| 1992 | 5 | 3 | 2 | 143,153 | 4,194 | 138,960 |
| 1993 | 5 | 2 | 3 | 144,442 | 3,674 | 140,768 |
| 1994 | 5 | 2 | 3 | 145,719 | 3,219 | 142,500 |
| 1995 | 4 | 2 | 2 | 146,983 | 2,820 | 144,163 |
| 1996 | 4 | 1 | 3 | 148,236 | 2,470 | 145,765 |
| 1997 | 4 | 1 | 3 | 149,477 | 2,164 | 147,313 |
| 1998 | 4 | 0 | 4 | 150,707 | 1,896 | 148,811 |
| 1999 | 3 | 0 | 3 | 151,927 | 1,661 | 150,266 |
| 2000 | 3 | 0 | 3 | 153,136 | 1,455 | 151,680 |
| 2001 | 3 | 0 | 3 | 154,335 | 1,275 | 153,059 |
| 2002 | 3 | 0 | 3 | 155,523 | 1,117 | 154,406 |
| 2003 | 3 | 0 | 3 | 156,702 | 979 | 155,723 |
© Applied Economics – archived original
These are impressive figures. Lives are saved and disease is averted due to the MMR vaccination. Conversely with no vaccine induced protection from measles lives are lost, disease is spread and disability and suffering ensues. There can be few better examples as to the efficacy of mass immunisation, or indeed, the danger of the anti-vaccine lobby.
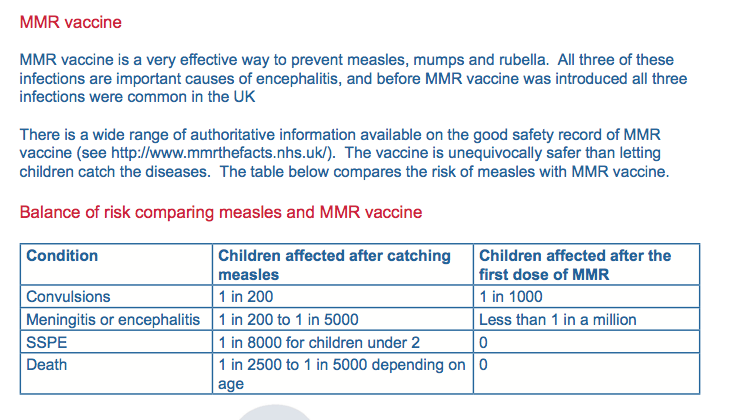
Consulting reputable publications we can see that measles is indeed a potentially very serious disease. Health authorities have never denied that vaccination carries a negligible risk. The anti-vaccine lobby is apt to demand vaccines be both 100% effective and 100% safe. As a public we are rather poor at assessing risk-benefit and thus many fall prey to the anti-vaccine slogans and lies.
Encephalitis is a one in a million plus risk as a consequence of measles vaccination. As a consequence of measles it is a one in a thousand risk. In short those who argue “natural immunity” is best subject their children to the risk of brain damage or death at a rate 1,000 times greater than had they chosen MMR. For every ten who contract encephalitis one will die and four will be permanently brain damaged. Around one third of those infected will develop complications that will likely require hospitalisation.
Depending on age, one child dies for every 2,500 – 5,000 cases of measles.
© The Encephalitis Society – Access full document here
Recently the vaccine-autism zombie had some life breathed into it. Fortunately it turns out that just as Wakefield perpetrated his original – and ongoing – fraud for money, the author of the latest scam is a member of a group erroneously believing vaccines cause autism and will stop at nothing to mislead the public to this same misconception. The “paper” was withdrawn in one month. A statement has been published by Dr. William Thompson who was deceived into becomming a “whistleblower”.
He was recorded against his will and it appears the anti-vaccine author Brian Hooker had worked for months to get the pro-vaccine Thompson on record as sounding like a whistleblower.
And so it continues. This is indeed not a drill. We do have reasonably healthy rates of vaccination but the return of measles, varicella and other vaccine preventable diseases means there is no room for complacency.
Make an informed decision. Vaccination saves lives.
Australian Immunisation Handbook – 2013
Measles Fact Sheet – WA Health
NCIRS – events in MMR vaccination practice
♠︎ ♠︎ ♠︎ ♠︎
Last Update: 10 January 2024